Using Speed Monitoring Data to Improve Road Safety
Speeding drivers are more likely to be involved in collisions, and crashes at higher speeds are more likely to result in severe injuries and deaths. Accurate road use data, with speed, traffic counts and journey paths being key behaviour insights, help identify trends, accident hot spots, and support better planning, monitoring and assessment of interventions to improve road safety.

Did you know that halving the number of global deaths and injuries from road traffic accidents features in the UN Sustainable Development Goals? To achieve this, both the World Health Organisation (WHO) and the Organisation of Economic Cooperation and Development (OECD), consider the Safe System approach as best practice. This internationally adopted strategy recognises that human error is no longer the primary cause of road accidents, but rather, it is failures in the road system itself that pose the greatest risks.
Historically, road safety campaigns targeted human error and behaviour in an effort to reduce accidents and fatalities. Characters like Tufty Fluffytail, the road safety squirrel, and the Hedgehog Family, were the faces of advertisement campaigns targeted at children in a bid to raise awareness of the Green Cross Code. The importance of seat belts, not using a mobile phone whilst driving, the dangers of drink driving, driving fatigue and speeding, have all been key campaigns, all aimed at drivers. Whilst these are all vital for improving road safety, improving human behaviours alone is not enough.
Vision Zero – The Elimination of All Deaths and Serious Road Collisions from London’s Streets by 2041
In 2018 the Mayor of London launched Vision Zero, a Safe System model that aims to ‘reduce road deaths and serious injuries by 65 per cent by 2022, 70 per cent by 2030 and for all deaths and serious injuries from road collisions to be eliminated from London’s streets by 2041’.
People are people: people will make mistakes. Vision Zero is an approach that accommodates human error, shifting the responsibility of road safety off of the road user and on to the road system, and has been adopted by other councils across the UK including Kent, Warwickshire, Glasgow and Devon. Lowering speeds and reducing the volume of vehicles on the road are two key objectives of Vision Zero, identifying that making roads safer is fundamentally linked to the Healthy Streets ambition, whereby human health and experience is placed at the front and centre of urban planning.
SLOW DOWN!
People hit by a car travelling at 30mph are much more likely to be killed or seriously injured than if they were in a collision with a car travelling at 20mph. Not only is the risk of serious injury or death reduced by lowering speed, the collision is less likely to happen in the first place because of the associated reaction time and stopping distance.
Most large UK cities have adopted 20mph limits for residential streets. The Welsh government has committed to a national default speed limit of 20mph for urban and village roads, and the Scottish government have announced that all appropriate roads in built up areas will have a 20mph speed limit by 2025.
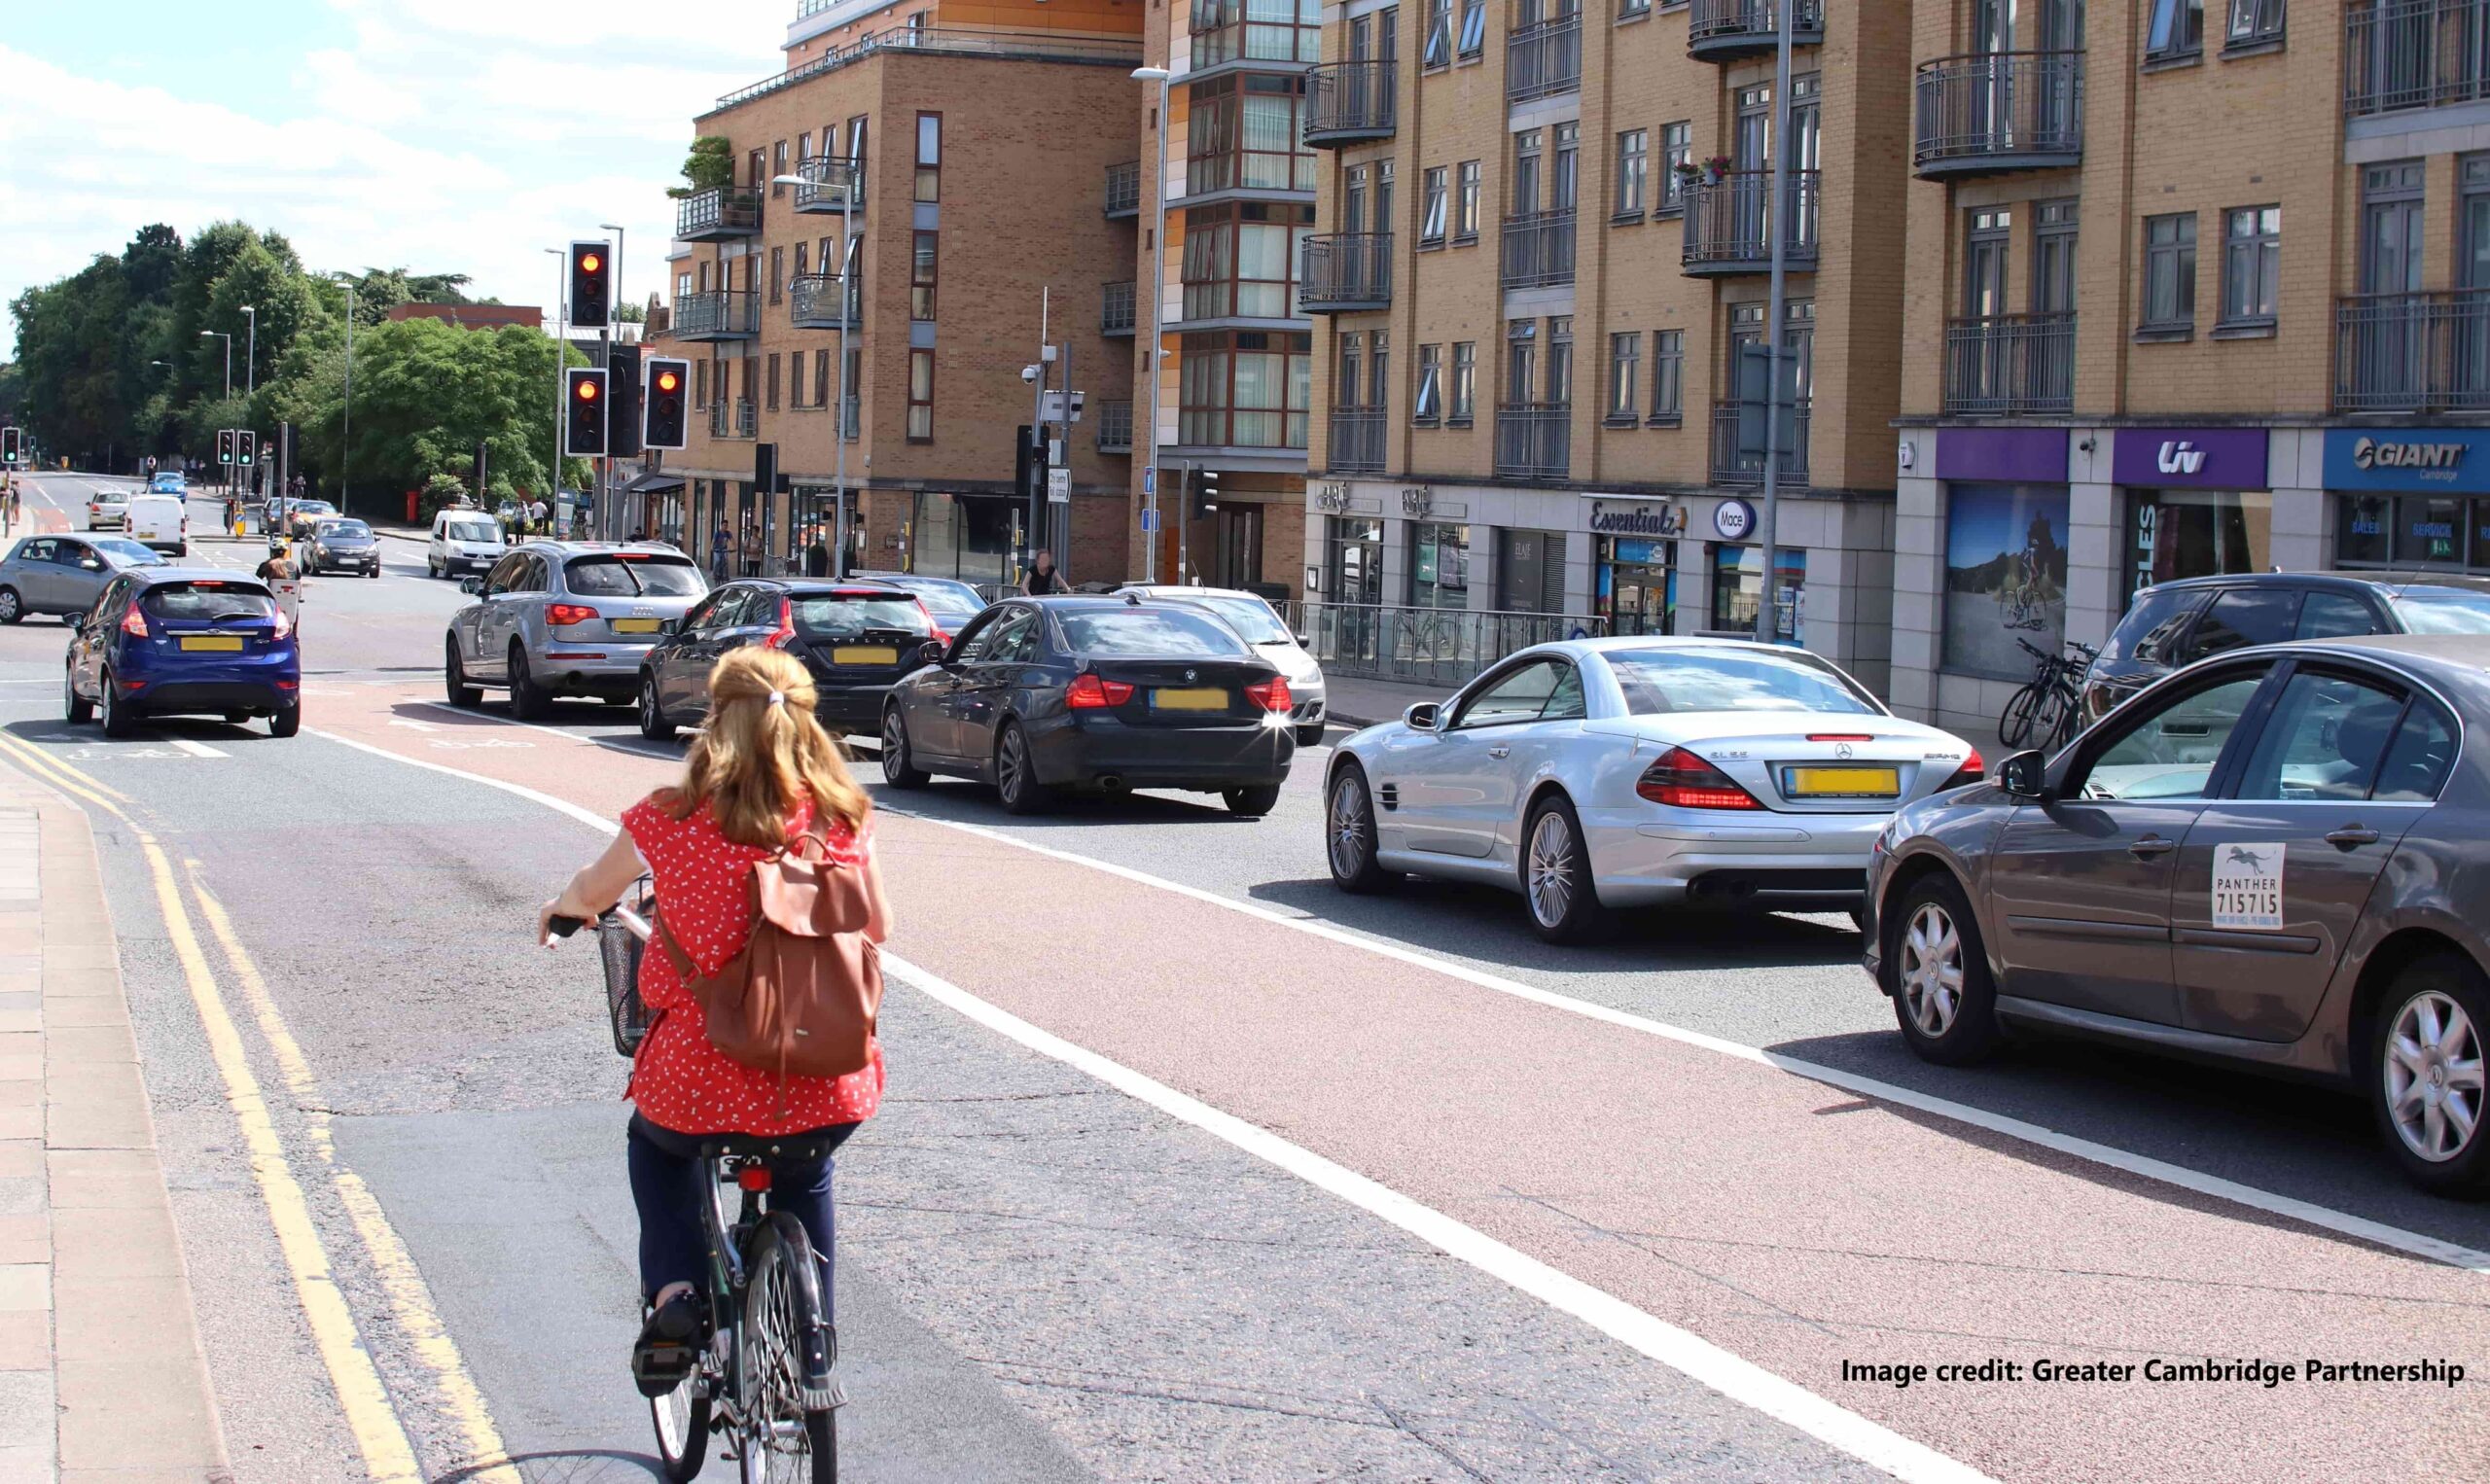
As well as reducing the likelihood and severity of road traffic accidents, lowering vehicle speed supports a modal shift towards active travel, by lessening the appeal of driving and thus reducing the volume of motorised vehicles on the road, making cycling and walking a more attractive option.
Alongside speed limits, there are lots of other methods for implementing lower speeds, including speed humps, centreline removal, surface treatments, gateways, chicanes and reduced corner radii. Narrowing road width using traffic islands and pedestrian refuges, trees and planters, or reallocating space for walking and cycling are also effective ways to reduce vehicle speed.
Temporary speed reducing strategies are gaining popularity too, such as street furniture that is strategically placed on parts of the road space on particular days of the week, or road closures that coincide with school pick up and drop off, known as school streets. Modal filtering using bollards or bus gates to create a low-traffic neighbourhood is another option. This is a strategy that sees residential streets grouped together and fast-moving through traffic from distributor roads made difficult or prevented altogether, again, making walking and cycling in these areas a more viable option.
Speed Monitoring is Vital
To ensure maximum effectiveness of these speed interventions – both permanent and temporary measures – it’s vital that robust and comprehensive road use and speed monitoring takes place. Multi-modal monitoring is especially important, as speed holds different risks for different road users as there is a hierarchy when it comes to vulnerability.
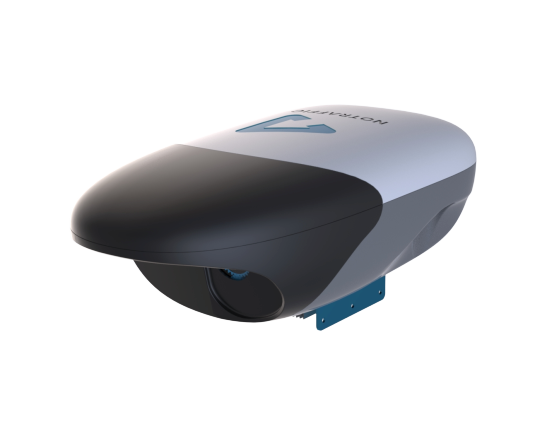
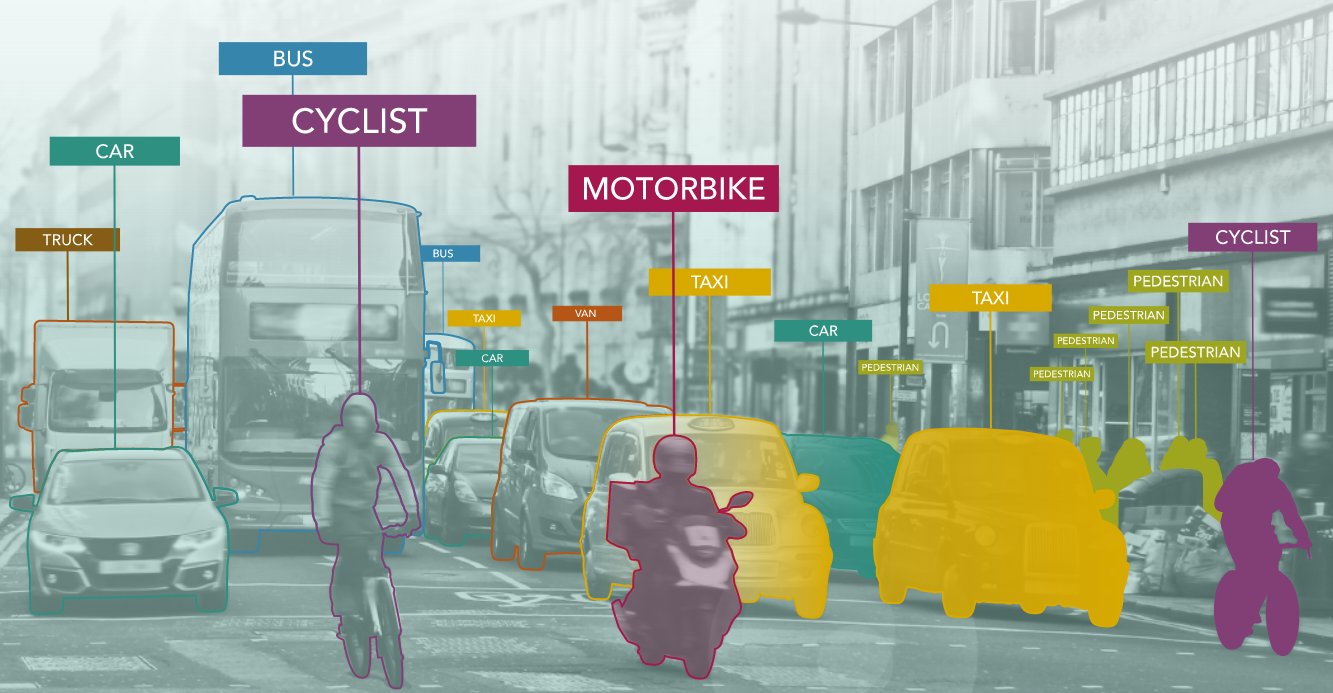
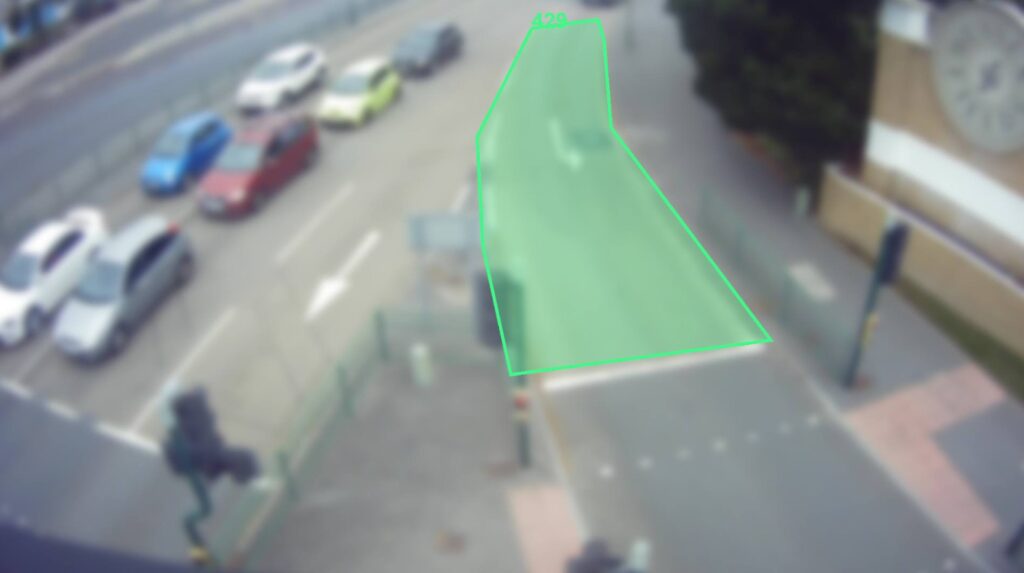
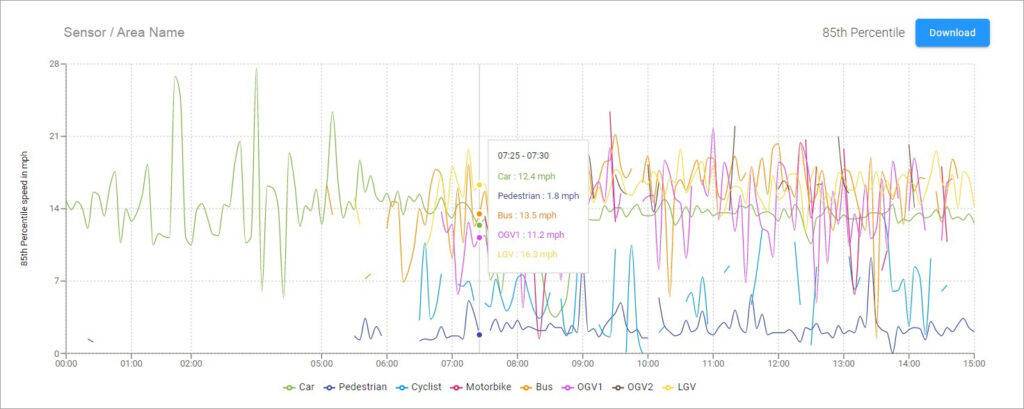
Vivacity’s AI sensors monitor accurate average speed data for different road user classes, including pedestrians, cyclists, cars, vans and HGVs. This analysis and insight is extremely valuable for planning and monitoring road safety schemes, including school streets and low-traffic neighbourhoods. The Zonal Speed dataset enables the analysis of changes in speed and relative speed according to the days of the week, time of day and road user classes.
With Zonal Speed datasets it’s possible to identify where speed limits are or are not being obeyed. This insight can help make the case for further speed lowering methods to be introduced to a particular stretch of road. The data is also valuable for assessing the success of a speed reduction measure, and paired with multi-modal classifications, can identify if reduced vehicle speed has increased pedestrian and cyclist counts as a result of roads feeling safer and more appealing. The average speeds of road users pre- and post-implementation of School Streets and low-traffic neighbourhoods schemes can also be assessed.
What’s Next?
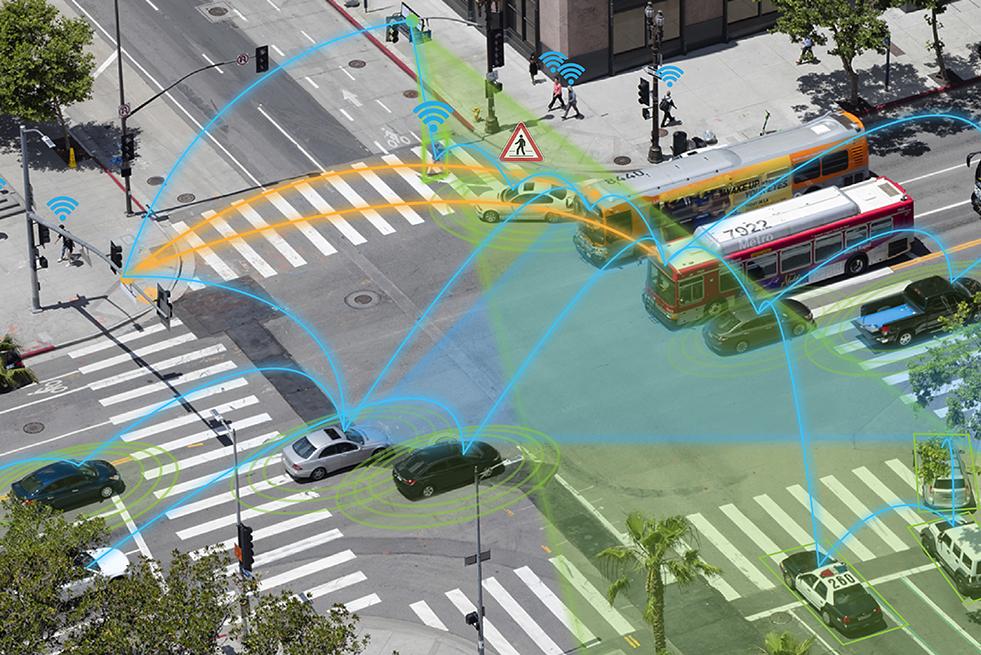
We’re currently developing Near Miss monitoring. This advanced capability utilises our sensors’ ability to track the ‘paths’ of a road user and identify underreported dangerous interactions between vulnerable road users and vehicles. Equipped with this insight, it will be possible to count both the total numbers of near misses, and understand trends in time periods for close interactions and quantify how often a near miss is likely to happen.
This article was originally published by Vivacity Labs Limited.