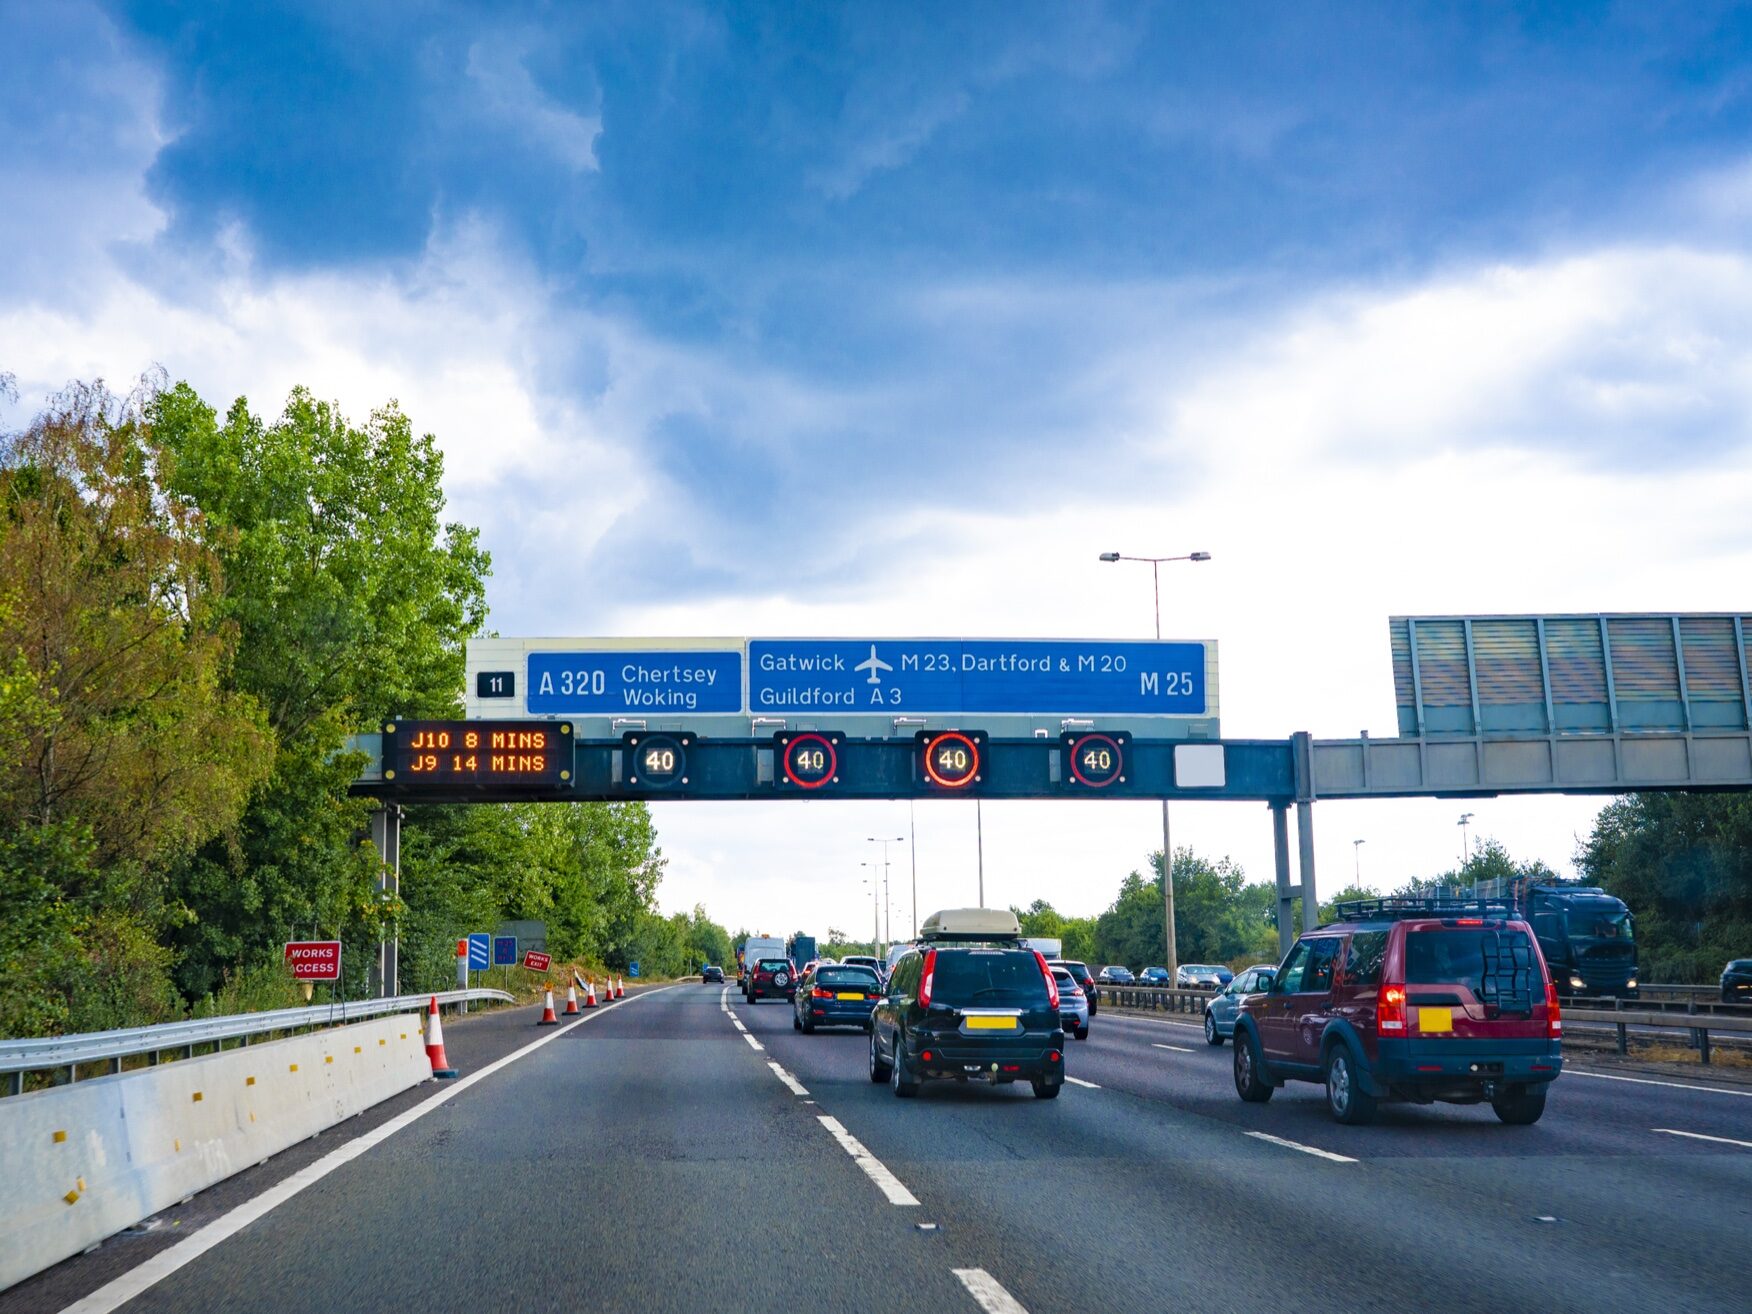
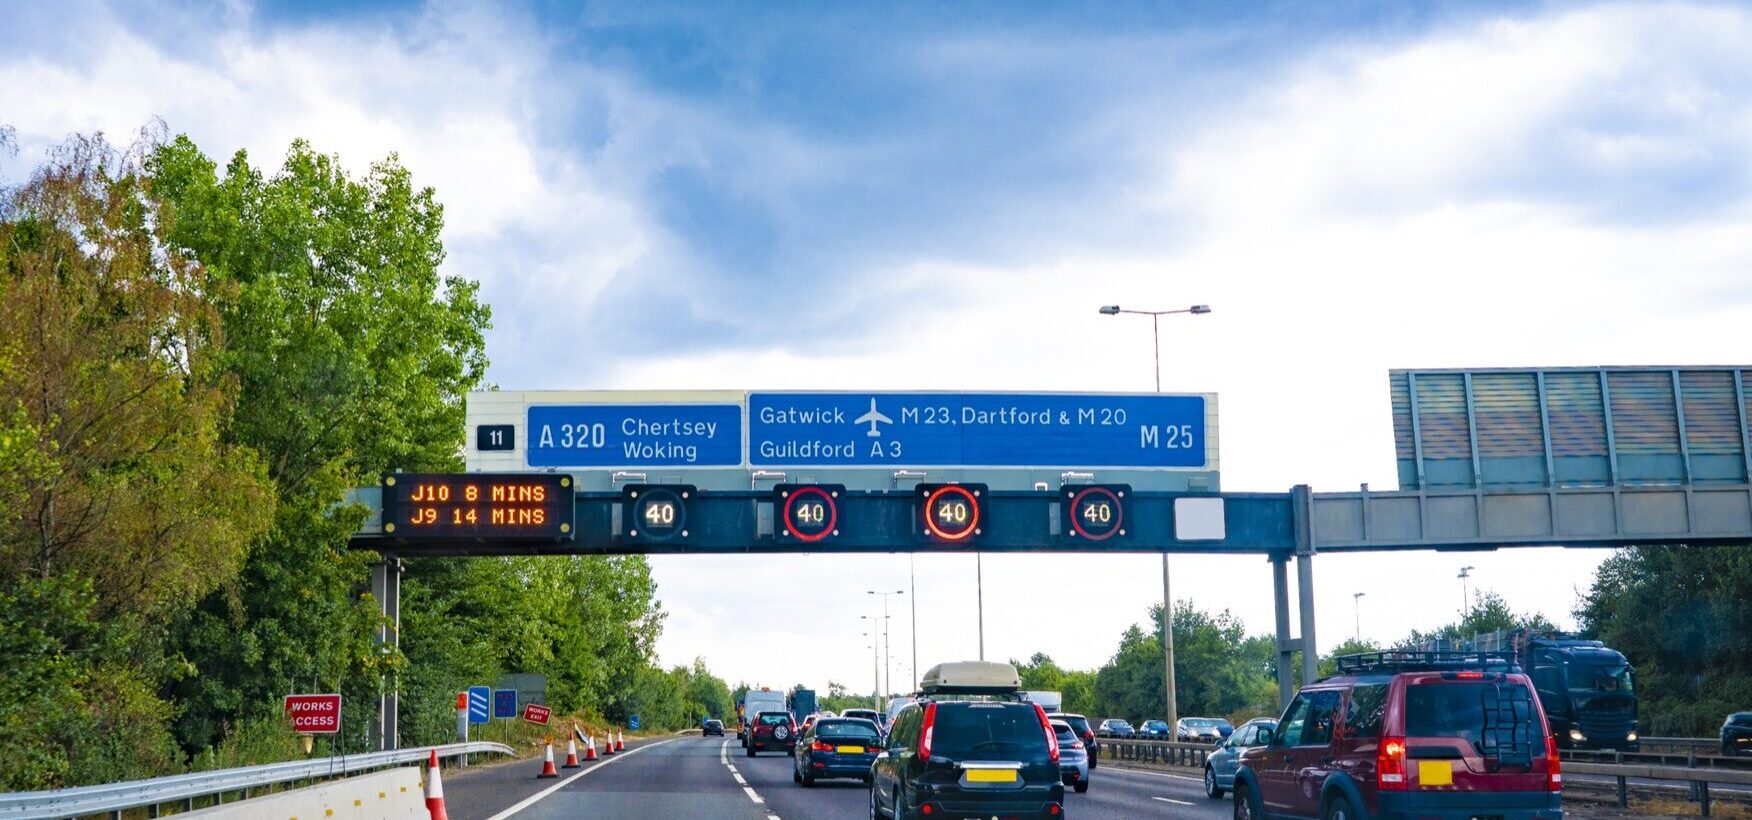
London is second-worst for road efficiency among seven European capitals, yet records less than half the rate of harsh driving events per trip of Paris and Madrid.
London records a far lower rate of harsh driving events than the city’s congestion would predict, according to new connected-vehicle data from Geotab, a global leader in connected vehicle and asset management solutions.

Geotab’s European Urban Freight Efficiency Index, based on full-year 2025 data from seven capitals, found a general link between how well a city’s roads flow and how often harsh events occur on them. Berlin, the most efficient city in the study, recorded the fewest harsh acceleration, braking and cornering events, at 225 per 1,000 trips. At the other end, Paris and Madrid recorded 1,191 and 1,088, more than one for every journey.
London breaks that pattern. It scores 29 out of 100 for road efficiency, ahead of only Madrid, yet records 462 harsh events per 1,000 trips, roughly one every two journeys. That is less than half the rate in Paris and Madrid, even though Paris scores higher than London for efficiency. Dublin (315), Amsterdam (356) and Rome (393) all sit between Berlin and London, in line with their stronger efficiency scores. London still logged 31.4 million harsh events across 2025, the second-highest total of the seven cities after Madrid’s 32.1 million.
Why London Drives Differently
Congestion charging and active enforcement may help explain why London’s rate is lower than its road network alone would suggest. The research does not isolate the effect of any single measure.
The contrast with Paris is sharpest. More than three-quarters (79%) of harsh events there are sudden accelerations, which may mean that drivers are pulling away hard from almost every standstill. London’s profile is more balanced, with acceleration at 45.5%, braking at 38.7% and cornering at 15.8%.
A lower harsh-event rate does not make London an easy place to operate. Stop-start traffic and unpredictable journey times remain a major challenge for fleets in the capital.
Where the Lorry Advantage Disappears
The Index also found that lorries move more efficiently than cars in five of the seven capitals, helped by professional route planning, set delivery windows and off-peak scheduling. London is one of the two exceptions, with lorries scoring 27 against 29 for cars. Bus lanes lorries can’t use, narrow delivery streets and loading routes that push deliveries into busy periods are all likely to play a part.
Benchmarking Drivers Against the City
For fleet managers, the findings show how strongly road conditions shape driver data. A driver recording around 1,000 harsh events per 1,000 trips would be close to average in Madrid, but more than four times the Berlin average. Judging drivers against the city they operate in helps fleets see which events come down to behaviour and which come down to the road.
Edward Kulperger, Senior Vice President, EMEA at Geotab, said:A harsh event rate only means something when you know which city the driver is working in. The same number can be an average day in London and a warning sign in Berlin. Where the pattern is sudden acceleration, coaching and in-cab feedback can make a real difference. Where it is sharp cornering at a particular junction, a change of route will often do more. Fleets that can see which of the two they are dealing with are in a much better position to act. That is what data and benchmarking make possible: they turn a city-level pattern into something a fleet can act on. Video telematics can also add the context behind an individual event, so a coaching conversation can start from what actually happened on the road.
For UK fleet operators, the findings underline the value of city-specific decisions: using connected vehicle data to benchmark driver behaviour against local conditions, focusing coaching where behaviour is the issue, and adapting routes and schedules around congestion.
Read the full European Urban Freight Efficiency Index here.
Methodology
The European Urban Freight Efficiency Index scores each city on a scale of 0 to 100, based on two dimensions evaluated separately for passenger vehicles and trucks, then combined using a 60/40 weighting (passenger/truck). The first dimension, how traffic flows, accounts for 75% of each vehicle score and covers congestion burden, uncongested windows and travel time variability. The second, what congestion costs, accounts for the remaining 25% and measures mid-trip vehicle idling.
Safety findings are reported separately from the index score. They use GPS-derived harsh acceleration, harsh braking and harsh cornering events, expressed per 1,000 trips so that cities of different size can be compared. Hotspot figures show the share of a city’s harsh events that fall within each small grid area (geohash cell). Events are inferred from GPS position data rather than accelerometer readings, so they may undercount on short road segments and overcount on curved roads, and are intended for relative comparison between cities, not as a count of collisions or incidents. All figures are based on full-year 2025 data (January to December) from Geotab’s connected vehicle platform across Berlin, Amsterdam, Dublin, Rome, Paris, London and Madrid, and represent a sample of connected vehicles, not a census.
This article was originally published by Geotab.